Global Business Flights Continues to Post Positive Numbers

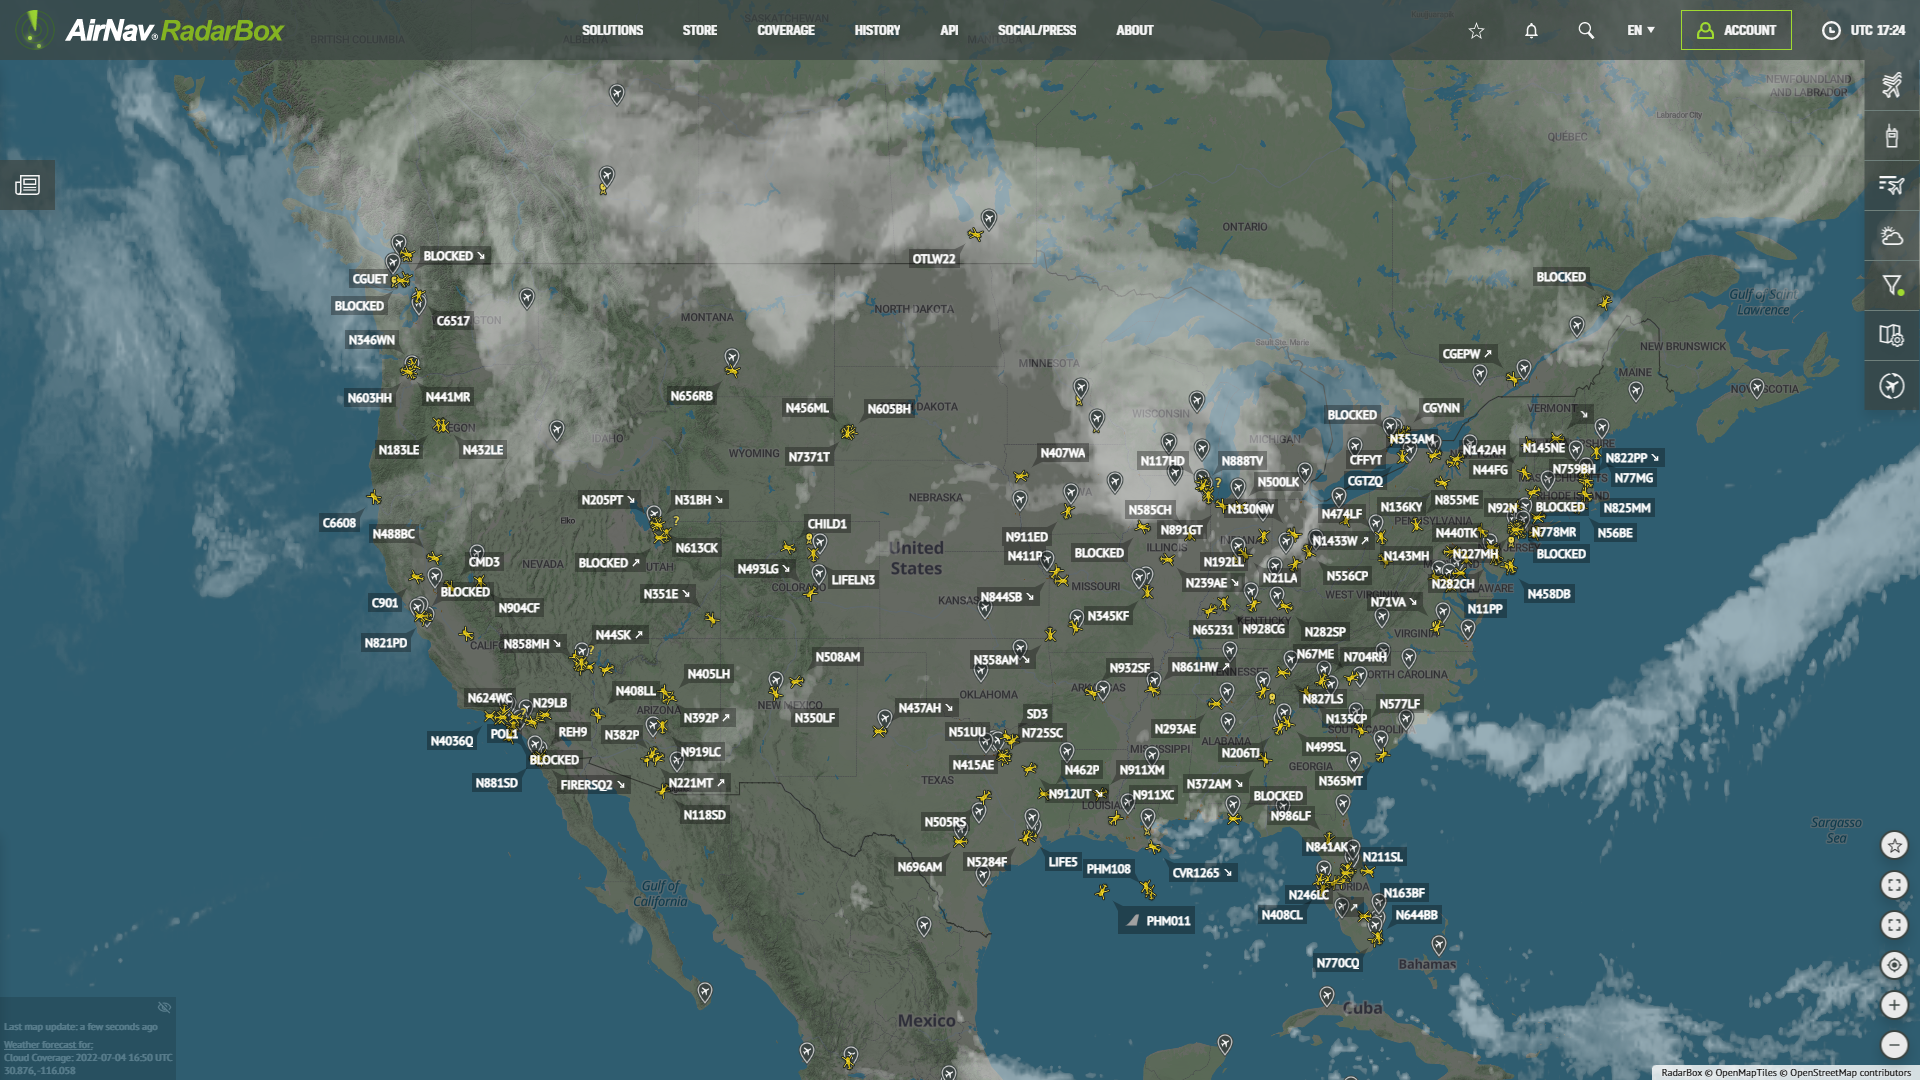
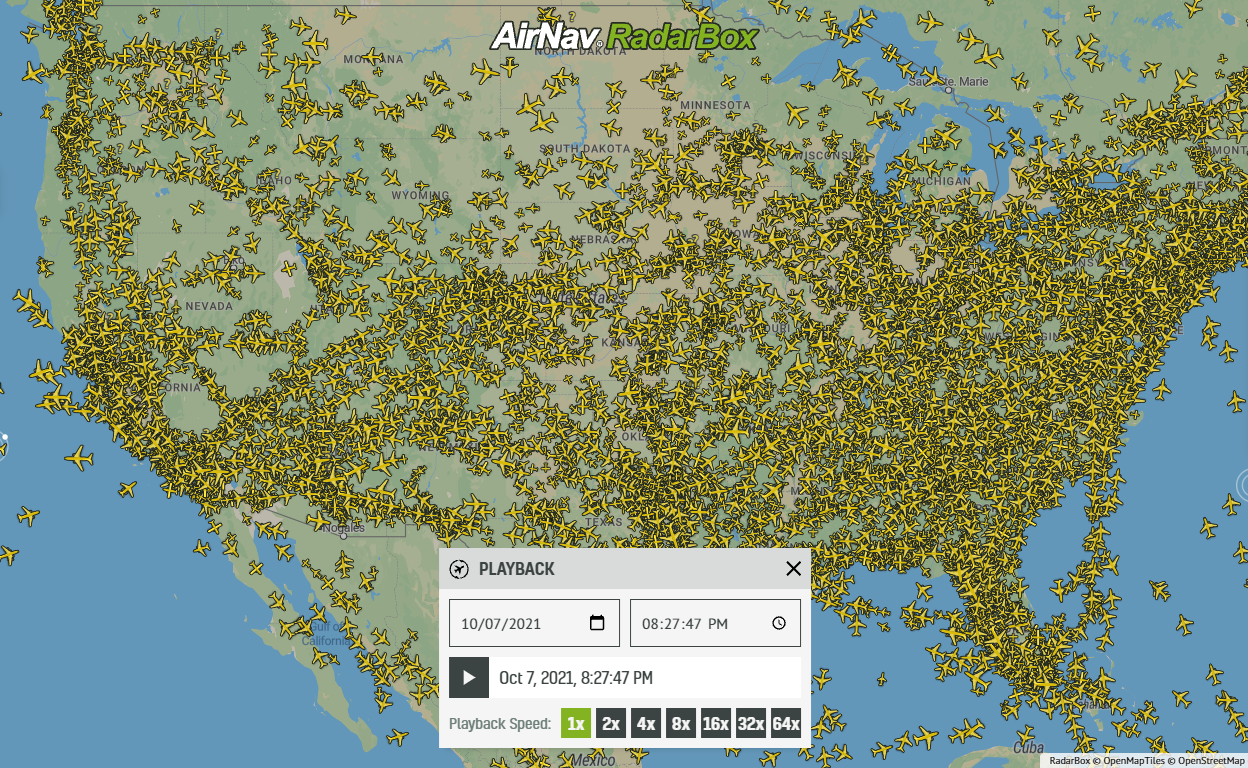
The Image Above: Worldwide Business Air Traffic Tracked Via RadarBox.com
As per AirNav RadarBox data, the number of business flights around the world increased by 35.67% this week compared to the same period last year.
Between October 16 and October 22, 83,069 flights were recorded, corresponding to a 30.66% growth over the 62,000 flights in the same period last year.
These figures are much higher than the pre-pandemic levels. While in the same period of 2019, 65,000 flights were recorded, it surpassed 80,000 executive flights this year.

The Image Above: Total Business Flight Statistics
2019: 60,005 (9,286 flights daily)
2020: 61,229 (8,747 flights daily)
2021: 83,069 (11,867 flights daily)
Business Jet Operators
NetJets is one of the business aviation airlines that is leading the race, with 7,583 flights operated during the week of October 16-22 and a daily average of 1,369 flights.

The Image Above: Business Flight Statistics for NetJets
2019: 6,104 (872 flights daily)
2020: 5,649 (807 flights daily)
2021: 8,316 (1,188 flights daily)
With a daily average of over 1,188 flights, NetJets has been posting double-digit growth, corresponding to +47.21%. Thus, NetJets' current growth is higher than in previous years (2019 and 2020).
NetJets Fleet Utilization Statistics on AirNav RadarBox:

According to our data, NetJets's two most utilized aircraft were: 1st - Bombardier Global Express (GLEX) and 2nd - Bombardier Global 500. NetJets currently has a fleet of 20 - Bombardier Global Express, which operates on average two flights per day and average 4.3 hours of flight time with an average flight duration of 2 hours.
The second most widely used aircraft is the Bombardier Global 5000, operating two flights per day with an average daily flight time of 3.8 hours and an average fleet flight duration of 1.8 hours.
NetJets Fleet Route Heatmap on AirNav RadarBox:

The top five most flown destinations (from/to) were:
1st - Teterboro Airport (TEB / KTEB) - 51.6 - (3.1%) Average Movements/Day
2nd - Palm Beach Intl. Airport (PBI / KPBI) - 42.1 (2.6%) Average Movements/Day
3rd - Westchester County Airport (HPN / KHPN) - 36.5 (2.2%) Average Movements/Day
4th - Dallas Love Field (DAL / KDAL) - 30.8 (1.9%) Average Movements/Day
5th - Washington Dulles Intl. Airport (IAD / KIAD) - 27.5 (1.7%) Average Movements/Day
Business Jet Airports

The Image Above: Business Flight Statistics for Las Vegas - McCarran International Airport (KLAS / LAS)
McCarran International Airport (KLAS / LAS), located in Las Vegas, is also one of the airports driving these positive flight statistics. Based on AirNav RadarBox data, between October 16 and October 22, 1,617 flights were recorded from & to the airport - with a daily average of 231 business flights and still, according to our data, with the growth of +106.25%.
Read the blog post about our exhibition at NBAA-BACE 2021 by clicking here.
Route Heatmap for Las Vegas McCarran International Airport (KLAS / LAS):

Among the most flown routes are:
1st - Los Angeles Intl. Airport (LAX / KLAX) - 352.4 (5.4%) Average Movements/Day
2nd - Denver Intl. Airport (DEN / KDEN) - 231.2 (3.6%) Average Movements/Day
3rd - Seattle Tacoma Intl. Airport (SEA / KSEA) - 215.8 (3.3%) Average Movements/Day
4th - John Wayne Airport-Orange County Airport (SNA / KSNA) - 208.5 (3.2%) Average Movements/Day
5th - Phoenix Sky Harbor Intl. Airport (PHX / KPHX) - 204.7 (3.2%) Average Movements/Day
Business Jet Models
Among business aircraft manufacturers, Embraer has been registering a +39.24% growth in the number of executive flights operated with Embraer jets across the world. From October 16 to October 22, 7,700 flights (1,100 daily) with Embraer family jets were tracked worldwide.

The Image Above: Embraer Jet Utilization Statistics Around The World
2019: 5,936 flights (848 daily)
2020: 5,530 flights (790 daily)
2021: 8,323 flights (1189 daily)
Conclusion
Unlike commercial aviation, cargo and business aviation is showing an increase above pre-pandemic levels. Cargo aviation is experiencing consultative growth mainly due to the high demand for cargo transport and the change in e-commerce and vaccines and medical supplies shipments.
One of the reasons for the increase in business aviation is that business and leisure travel continues despite the pandemic. The observed growth also comes mainly from the demand for cargo, aero-medical, and leisure flights, among other operations.
NetJest's data also indicates strong business aviation within the US, given that among the top 10 destinations flown by the business jet operator, all are located in the US. The trend is to increase the demand for this type of operation, even more, leading to a higher demand for business aircraft orders for the major manufacturers of executive jets.
Are you looking for an accurate and reliable flight data provider? Email us at - [email protected] or call us at - 1-800-401-2474 to discuss a tracking or data solution.
Find this and more exclusive flight statistics at - https://www.radarbox.com/statistics