August 2025: A Deep Dive into Global Aviation Statistics

The aviation industry is a dynamic and ever-evolving sector, constantly adapting to global events, technological advancements, and shifting passenger demands. In this blog post, we'll delve into our aviation statistics, examining the most active airlines, the busiest airports, and the historical flight activity trends, all supported by our recent data.

When we look at the sheer volume of daily flights, some airlines stand out. The first chart, 'Most Active Airlines,' provides a clear picture of which carriers are dominating the skies in terms of average daily flights. This metric is a strong indicator of an airline's operational scale and market presence.
As of the latest data, American Airlines (AA / AAL) leads the pack with an impressive 6,360 average daily flights. This highlights its extensive network and frequent service across numerous routes. Following closely are Delta Air Lines (DL / DAL) with 5,243 flights and United Airlines (UA / UAL) with 4,967 flights. The dominance of these major U.S. carriers underscores the robust domestic and international travel demand within and from the United States.
Southwest Airlines (WN / SWA) also features prominently with 4,017 daily flights, showcasing its strong position in the low-cost carrier segment. Interestingly, the chart also includes international players like Ryanair (FR / RYR) from Europe, with 3,567 flights, and China Eastern Airlines (MU / CES) and China Southern Airlines (CZ / CSN) from Asia, with 2,567 and 2,449 flights respectively. These figures demonstrate the global nature of air travel and the significant contributions of airlines from different continents to the overall flight volume.
IndiGo (6E / IGO), Air China (CA / CCA), and LATAM Airlines (LA / LAN) round out the list, each contributing thousands of daily flights. This diverse representation of airlines from North America, Europe, Asia, and South America illustrates the widespread and interconnected nature of the global aviation network. The number of daily flights directly correlates with an airline's capacity to serve passengers and cargo, making it a crucial statistic for understanding market share and operational efficiency.

Just as airlines have varying levels of activity, so do airports. The second chart, 'Busiest Airports,' provides insights into the average daily movements, which include both takeoffs and landings, at the world's most active air hubs. These airports serve as critical nodes in the global transportation network, facilitating connections for millions of passengers and tons of cargo.
Topping the list is Chicago, IL (ORD / KORD), with an impressive 2,554 average daily movements. This highlights O'Hare International Airport's strategic importance as a primary gateway in the United States. Atlanta, GA (ATL / KATL), home to Hartsfield-Jackson Atlanta International Airport, follows closely with 2,322 movements, solidifying its position as one of the world's busiest airports by passenger traffic. Dallas-Fort Worth, TX (DFW / KDFW), and Denver, CO (DEN / KDEN), also demonstrate significant activity, with 2,184 and 2,092 daily movements, respectively.
The presence of multiple U.S. airports at the top of this list underscores the robust domestic air travel market in the United States. However, the chart also features prominent international airports, indicating the global nature of air traffic. Istanbul (IST / LTFM) emerges as a key European hub with 1,752 movements, reflecting its growing importance as a bridge between continents. Los Angeles, CA (LAX / KLAX), another primary U.S. international gateway, records 1,689 movements.
Asian powerhouses like Shanghai (PVG / ZSPD) and Guangzhou (CAN / ZGGG) also make the list, with 1,559 and 1,491 daily movements, respectively, showcasing the rapid growth of air travel in the Asia-Pacific region. Finally, Amsterdam (AMS / EHAM) contributes 1,471 movements, maintaining its status as a vital European connection point. The high volume of movements at these airports signifies their crucial role in facilitating global commerce, tourism, and connectivity.
The aviation industry experienced an unprecedented disruption in 2020 due to the COVID-19 pandemic. The third chart, ‘Historical Flight Activity by Year (7-day AVG),’ vividly illustrates this impact and the subsequent recovery trajectory of commercial flight activity from 2019 to 2025.
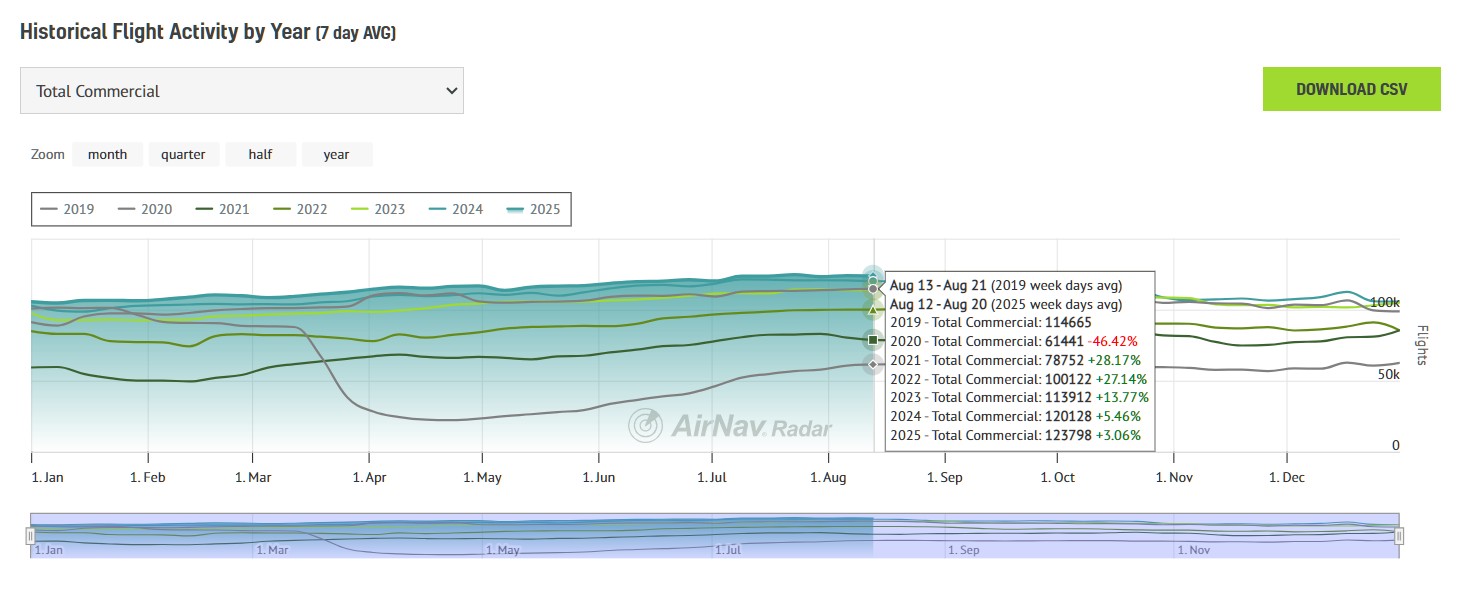
The year 2019 serves as a baseline, representing pre-pandemic flight levels, characterized by consistent high activity. However, 2020 saw a dramatic and immediate decline in flight operations around March and April, as global travel restrictions and fear of the virus brought air travel to a near standstill. This period marked the lowest point for the industry, with activity plummeting by 46.42% compared to 2019 levels, as shown by the data for August 13-20, 2020 (61,441 total commercial flights vs. 114,665 in 2019).
Since then, the industry has been on a path of gradual but steady recovery. In 2021, flight activity increased by 28.17% over 2020, reaching 78,752 flights. This upward trend continued into 2022, with a 27.14% increase to 100,122 flights, and further into 2023, with a 13.77% rise to 113,912 flights. By 2024, the industry had not only recovered but surpassed pre-pandemic levels, showing a 5.46% increase over 2023, reaching 120,128 flights.
The partial data for 2025 indicates continued growth, with a 3.06% increase over 2024, reaching 123,798 flights. This consistent growth across consecutive years underscores the resilience of the aviation sector and the strong demand for air travel.